
Visualizations for incidents in Cary using Tableau
- Sifei Liu
- Dec 11, 2022
- 3 min read

Sifei Liu, Danhua He, Xueqi Wang, Yiqing Cui
Based on the three datasets we have, crash, incidents and fire that have happened in Cary, North Carolina in recent years. We mainly made showcase these data visualizations to the city manager of Cary to better enforce public security, provide appropriate accident prevention, and exercise supervision over the work of different public Departments.
There are mainly four parts in our analysis, including the overall analysis of the three datasets and three respective analyses based on each dataset.
PART 1: Overall Analysis
We first give an overall analysis on the first dashboard.
From the dashboard, we can see that more crash incidents happened in eastern Cary on Walnut Street. More crimes were committed in southern and eastern Cary, along U.S. Route 1 and close to Williamsburg Manor. The distribution of fire alarms was less concentrated, most of which were from Cary’s middle and west regions. According to the predictions we made in two years based on present data, the number of crash incidents in 2021 and 2022 is likely to increase by 53.69%.

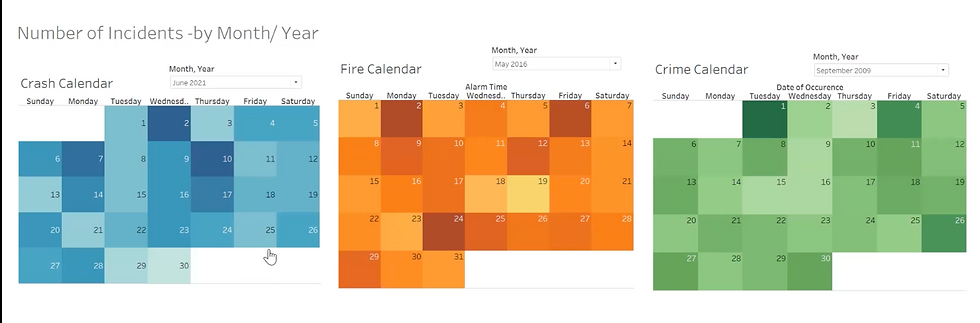
We also made a calendar to show the number of incidents that happened in different months and years in different departments.
PART 2: Crash Analysis
In the second part, we analyze the crash dataset in detail. We firstly made this interactive trend graph to show time distribution of car accidents. We can see that the general trend of the number of car crash is consistent and the value will always hit the peak in December. The number also dropped significantly in 2020, mostly because of the COVID.

Then we are curious about the contributing factors of the crash. Based on this word cloud, we can know that "coming from behind" and "parked vehicle" are the most important two factors.

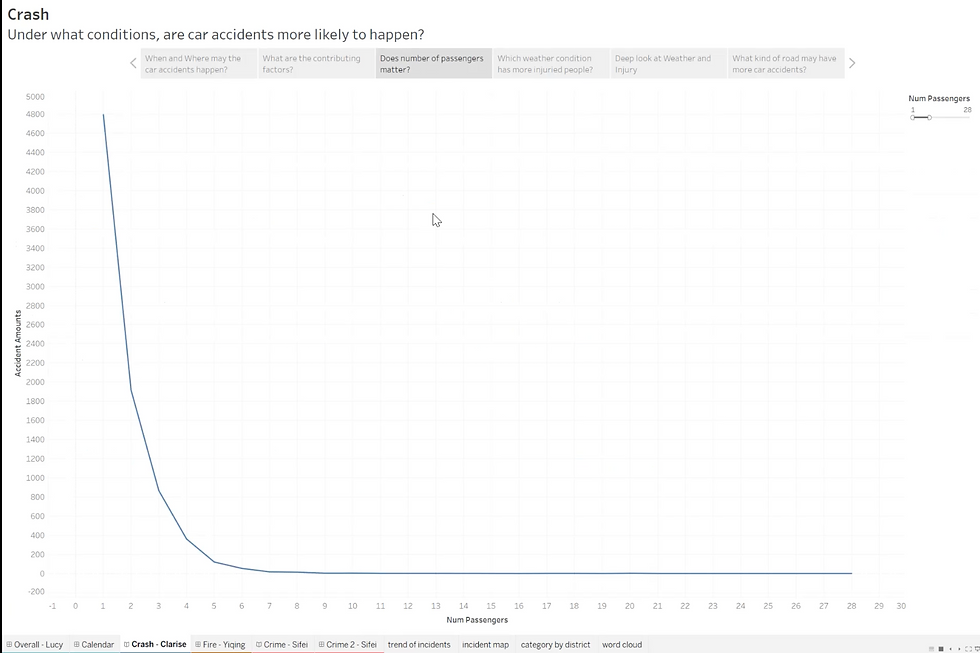
We also investigated on the relationship between the crash and number of passengers in the car. We found that there is an inverse relationship, in that more passengers make the driver more cautious.
Besides, we found that weather condition is also another contributing factor. Specifically, crash tends to happen more on clear days.

On account of this counterintuitive relationship, we decided to take a deep look at it. It is shown in the chart that a higher proportion of injuries happen during rainy days.

And then we focus on the road conditions which lead to most crash accidents. The main features are smooth asphalt, two-way (not divided), state secondary route, and straight, level road.

PART 3: Fire Analysis
This part is mainly divided into two questions. The first question, how is the performance of each district in responding to fire incidents? This question can be answered by the first two charts above.
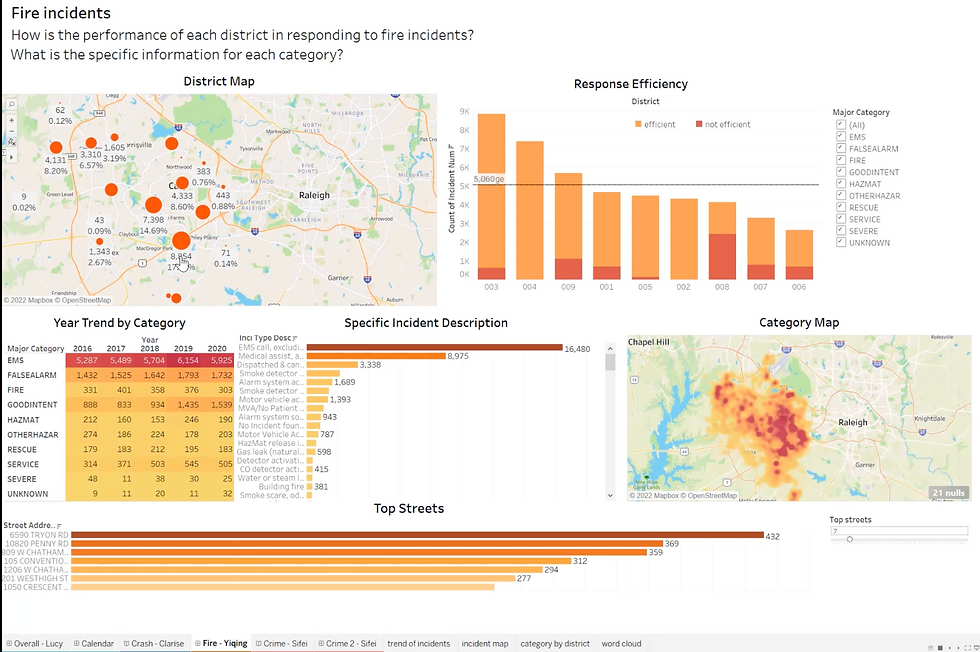
For example, from the District Map, we can see that in the 003 district, it has the highest number of incidents. When you click on the district, the number of incidents in each categories will also be shown. Also, from the Response Efficiency, we can see the relative proportion of efficient and non-efficient, and the district 008 has the least efficiency.
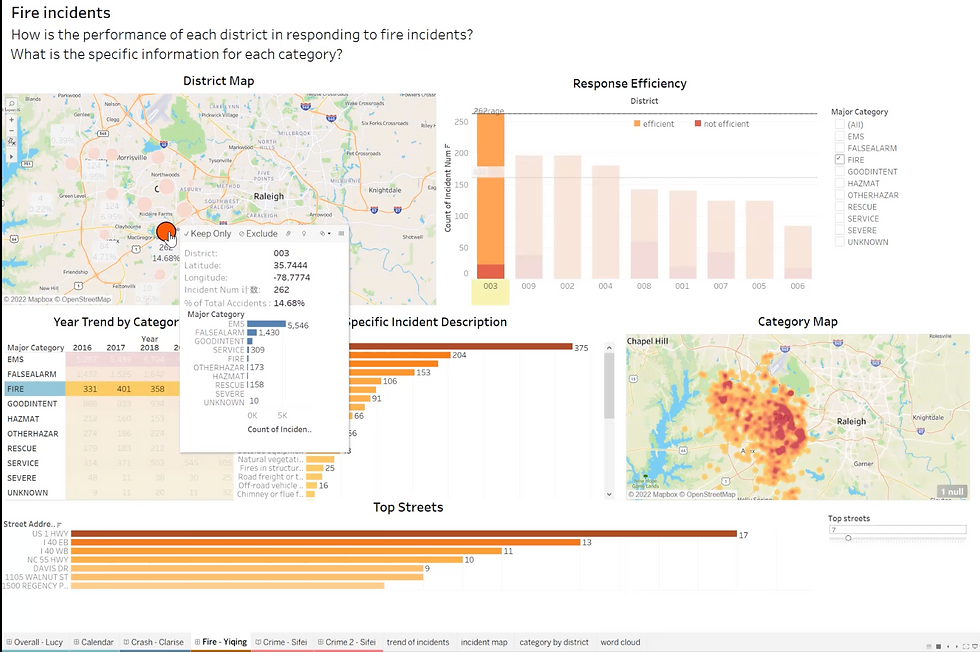
The second question is what is the specific information for each category? By selecting a particular category, all of the charts below will be interactively changed according to the incident type, showing the number in each subcategory, regional distribution and the street where most incidents happened (slider can also be used to choose the scale).

PART 4: Crime Analysis
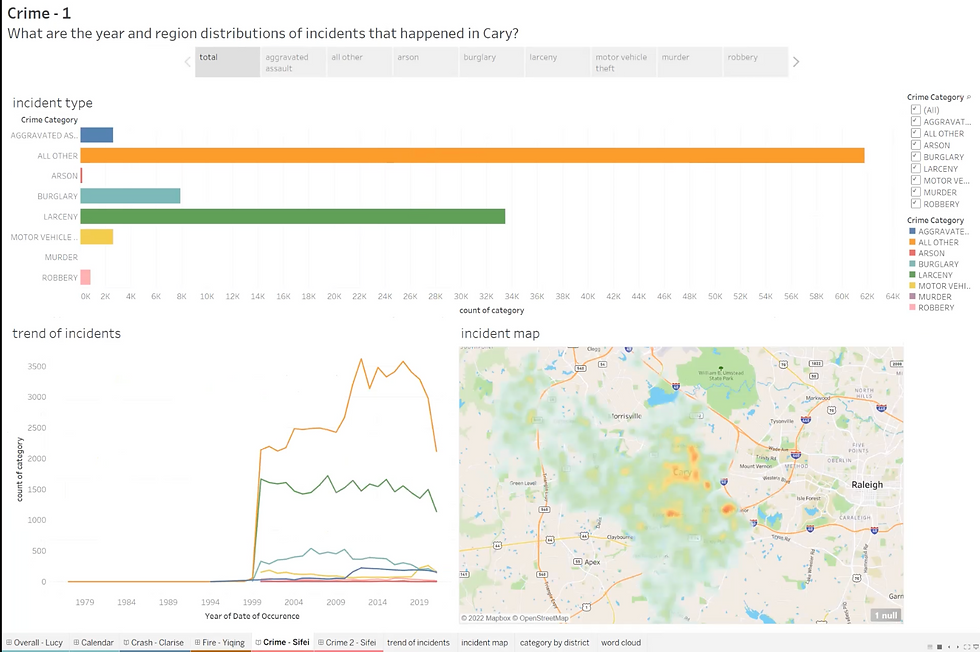
The third database shows all categories of crime incidents. On the first interactive dashboard as below, we can know more about the time trend and regional distribution of each category. Among, all categories, there might be some irregularities in time trend, such as burglaries and robbery. In this case, we can mainly depend on the heat map on the right to improve on security and decrease crime rate, in that the police can be more efficient according to the particular areas shown in the map.
In order to see more clearly in what month and what time of the day do most incidents happen, we made another interactive dashboard as below. Based on this, we found that most of the crimes, such as aggravated assault, burglary, larceny, motor vehicle theft and robbery, mainly centered in winter and summer. Most of them also happened the most during midnight and noon, so that the police can focus more on those time slots.

All in all, based on three datasets and the analyses we made, we recommend that the city manager can take segregation of duties and focus more on particular time and regions to more efficiently control the situations.


Comments