
Real Estate Analysis using R
- Sifei Liu
- Feb 1, 2023
- 2 min read

Updated: Mar 16, 2023
There are mainly two datasets, the price of real estate before 2009 and after 2009. I firstly deal with the price before 2009 by changing data form, removing some of the missing values and dropping some columns. After that I conduct a multiple linear regression on all the variables, setting SalePrice as the response and store the results in regBefore2009.
In order to improve the accuracy of the model, I choose a maximum of 15 variables and create another, smaller regression, and call it regBefore2009optimal. Below is the summary of the new model.
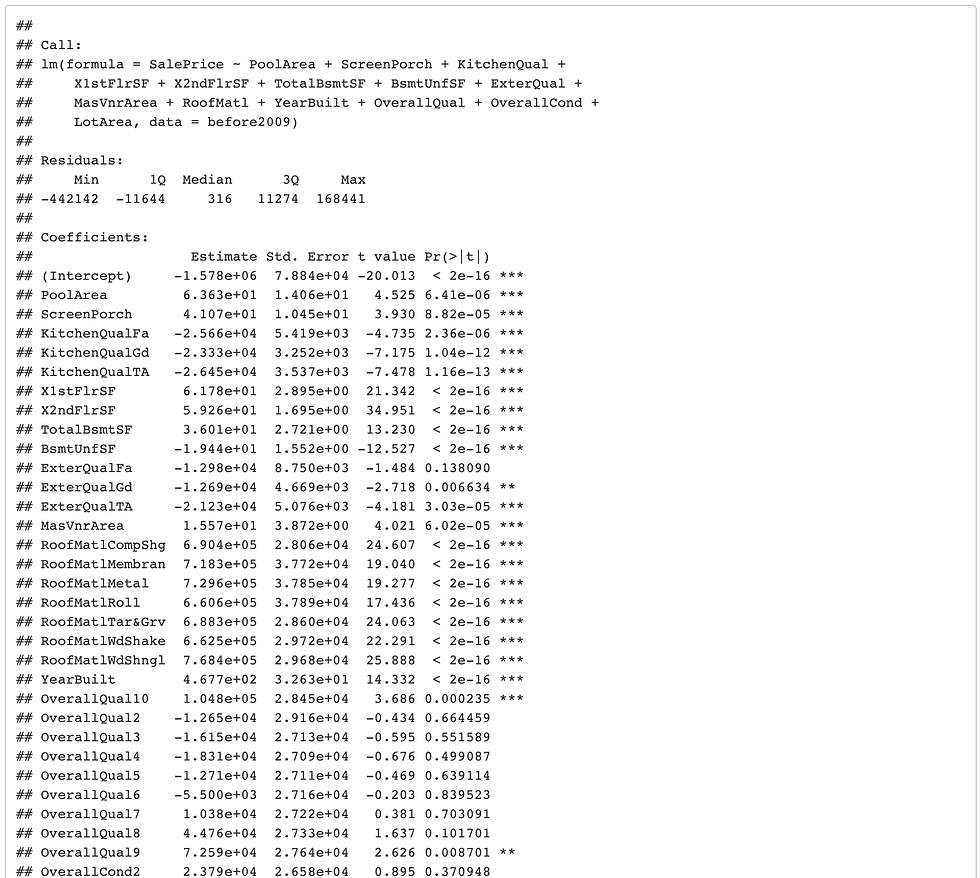

In order to see whether this model is a better fit, I display diagnostic plots of new regression.

After that, I repeated my procedures on the dataset price after 2009, such as removing some missing values and dropping some columns.
Besides, I was also informed a background where local authorities found in 2011 that there was housing fraud taking place in several neighborhoods, including NAmes, Gilbert and NridgHt, in 2009 and 2010. For fraud analytics purpose, I make a density plot (which data scientists often use to catch outliers or anomalous activity) of SalePrice (after 2009) for all the neighborhoods (with or without fraud) and arrange them all in a grid.

As you can see, the density plot for NAmes between 2009 and 2010 does not look any different from other density plots. If there are fraudsters, they are making an effort to mask their activities. So I try to compare SalePrice in NAmes and Gilbert before 2009 and after 2009 respectively to see if there is visual evidence of anomalous activity.

In NAmes, there isn't much evidence of anything anomalous but the density plots for Gilbert suggest something is definitely unusual about the housing prices. After a closer look, it appears that in their attempt to misrepresent the data, the fraudsters appear to have entered the mean value of the houses in NAmes before 2009, i.e. 142769.7, as the value of all the houses whose sale price they were fabricating (even if these houses were not in NAmes). The fraudster was likely to hope that not-so-smart fraud detectors would just check to see if the mean of the house prices before and after 2009 were roughly the same (and not look any further assuming that any changes coming from fluctuations in house prices).
You may feel that the fraudsters were not very careful in masking their activity after identifying the fraud pattern. However, we don’t have sufficient evidence to claim that this is fraudulent activity (just based on the density plots). I will now use multiple linear regression to attempt to get more evidence. So I run a regression on the data in after2009 using variables you already know to be good at predicting the SalePrice and store the result in variable called regAfter2009optimal. To see whether it fits, I also display the diagnostic plots of my regression.

By focusing on the Residual vs. Fitted graph, I found that there is a stretch of points that demonstrate an unexplained pattern in the residual plot. These points form a diagonal line sticking out of the clumped residuals in the residual plot from around (x, y) = (150,000, 0) to around (-430,000, -29,000). This suggests that an anomalous pattern in the data.


Comments