
FlightDelays Analyses using R
- Sifei Liu
- Jan 25, 2023
- 2 min read

In order to get familiar with the fraud analytics process model: 1. identify problem 2. identify data sources 3. select data 4. clean data 5. transform data 6. analyze data 7. interpret model 8. refine model, we searched a dataset describing delays in flights to get insights for the reasons.
1. Identify Problem
Flight cancellations and delays due to weather are not the airlines’ responsibility. Our goal is to detect and report any delays that are not due to weather for further investigation.
2. Identify Data Sources
We will analyze data in nycflights13 because it contains information about all flights originating from NYC airports. (https://cran.r-project.org/web/packages/nycflights13/nycflights13.pdf) with a focus on finding information about cancellations/delays and weather.
3. Select and Clean Data
In order to better observe the data, I printed the structure and statistical summary of the data:

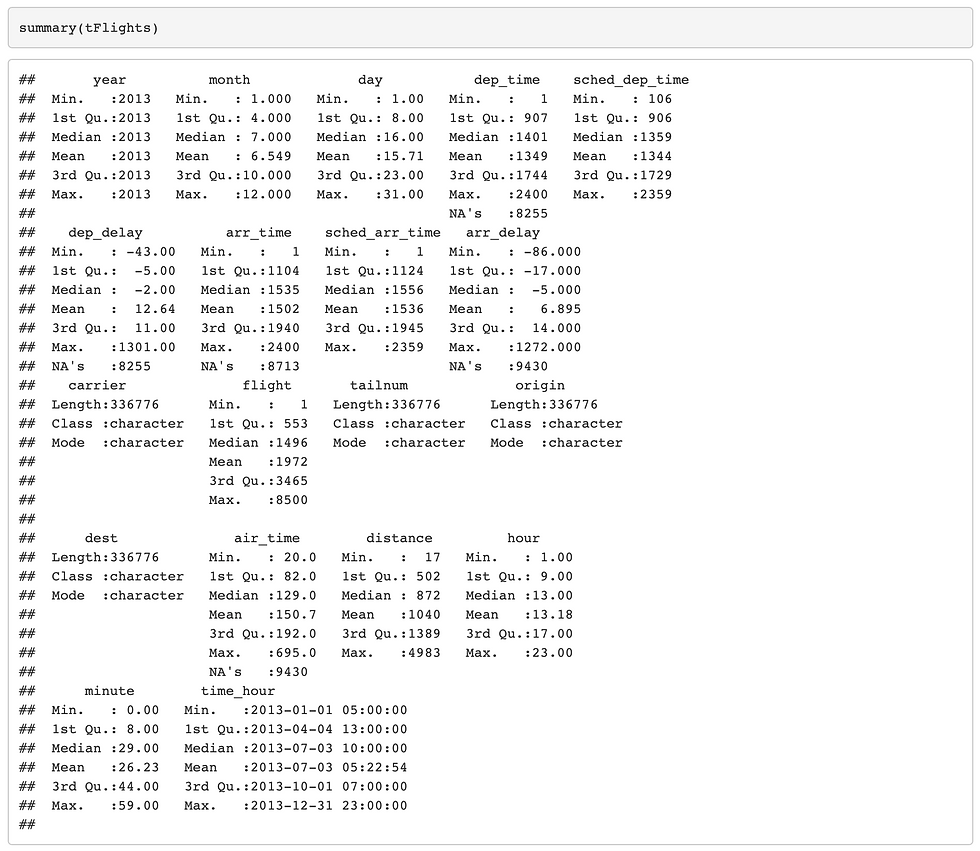

Using the information above, I decided to use some of the columns in tFlights:
#year, month, day: Date of departure. #dep_delay: Departure delays, in minutes. Negative times represent early departures/arrivals. #carrier Two letter carrier abbreviation. See airlines to get name.#flight Flight number. #origin, dest Origin and destination. See airports for additional metadata. #hour, minute: Time of scheduled departure broken into hour and minutes. #time_hour Scheduled date and hour of the flight as a POSIXct date. Along with origin, can be used to join flights data to weather data.
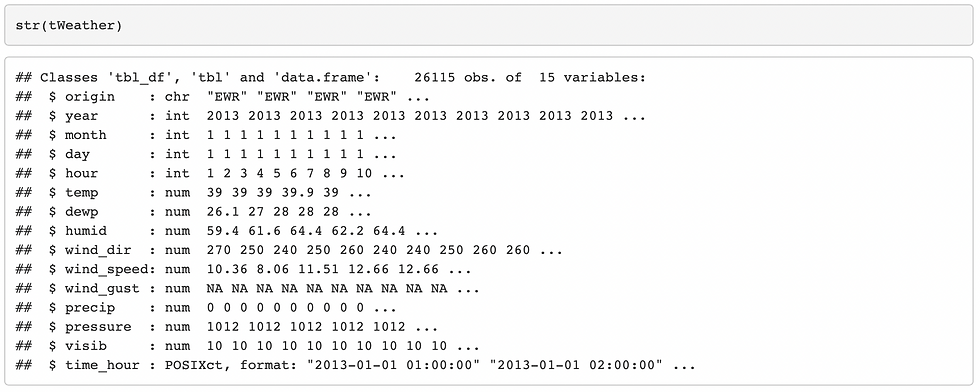
And some of the columns in tWeather:
#origin Weather station. Named origin to facilitate merging with flights data.
#year, month, day, hour Time of recording.
#temp, dewp Temperature and dewpoint in F.
#humid Relative humidity.
#wind_dir, wind_speed, wind_gust Wind direction (in degrees), speed and gust speed (in mph).
#precip Precipitation, in inches.
#pressure Sea level pressure in millibars.
#visib Visibility in miles.
#time_hour Date and hour of the recording as a POSIXct date.
4. Transform Data
This usually includes merging and sometimes includes sampling and other techniques.
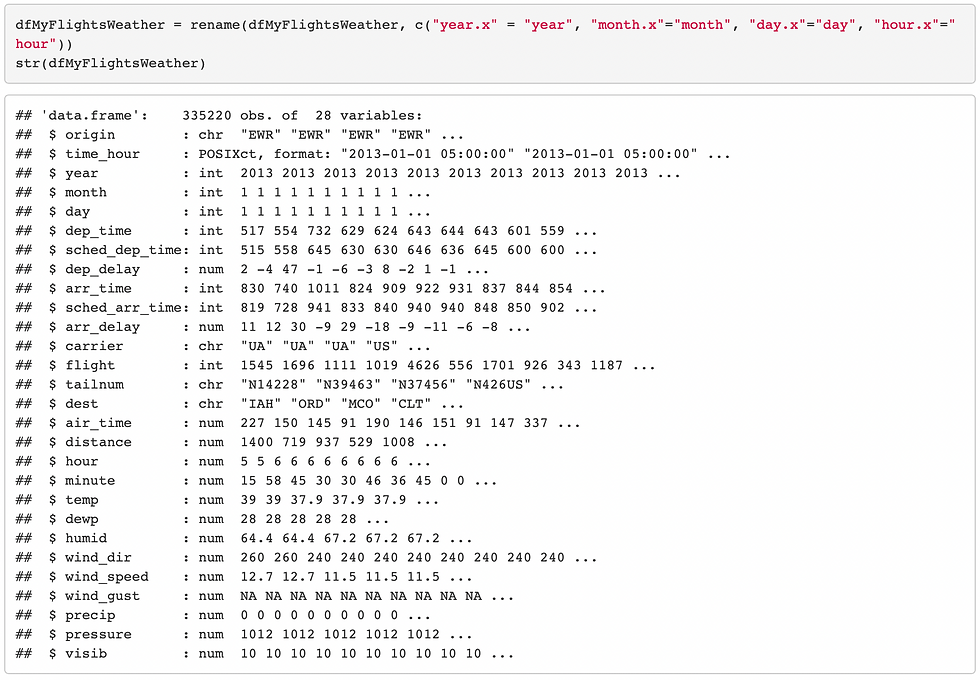
By that, I firstly merge the useful columns in the flights and weather datasets to form one dataset with all the information you need in one data frame. Then, I printed the structure of the merged dataset. I also removed redundant data in merged dataset and rename some of the columns to make the datasets more clean.
5. Analyze Data and Interpret Model
I firstly plot a simple histogram of all values in the dep_delay column and printed the statistical summary of it.
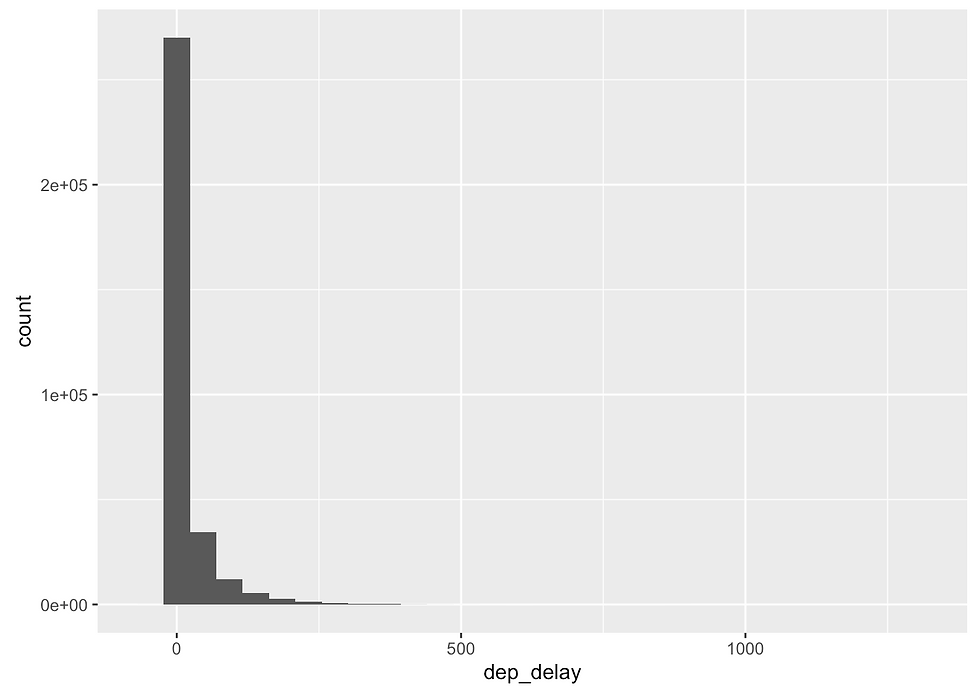
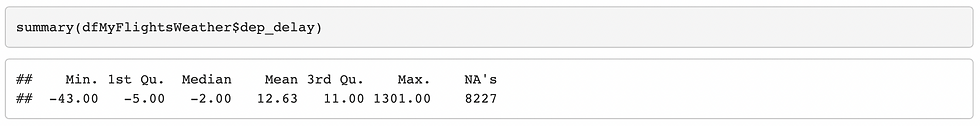
Through this analysis, I found that:
1. It has Long right tail.
2. Most flights are not delayed.
3. Those delayed are significantly delayed.
4. 8227 flights are NA (further research indicates that they were likely canceled).
After removing canceled flights and NA values, I plot a simple histogram of all values in relative column and printed the structure of it.


Later, I try to visualize the dependency on weather components, such as temperature, dew point, relative humidity, wind direction, wind speed, wind gust, precipitation, pressure and visibility.
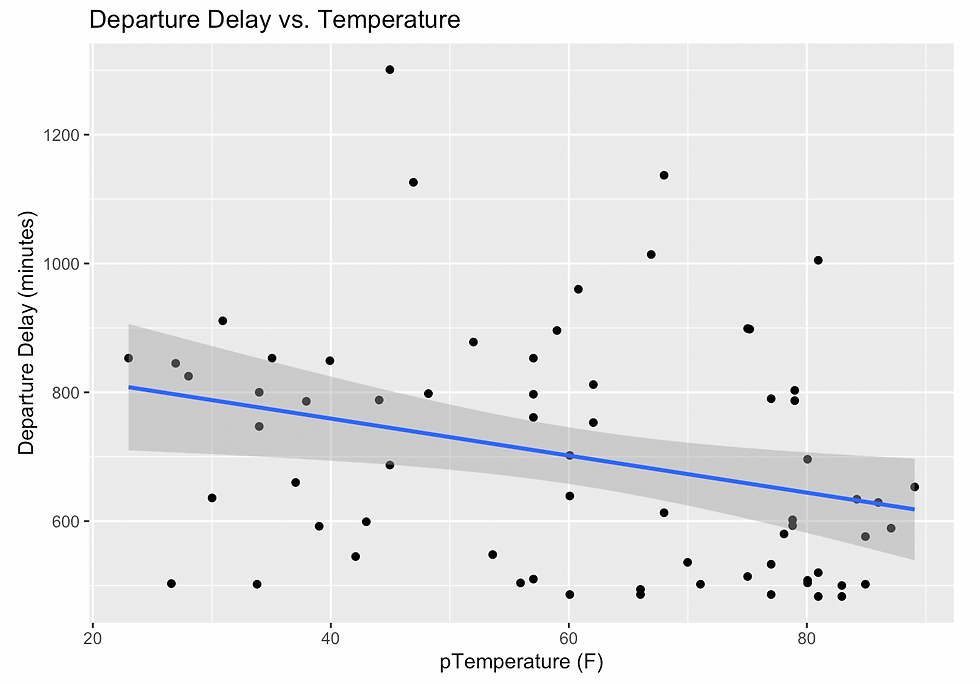


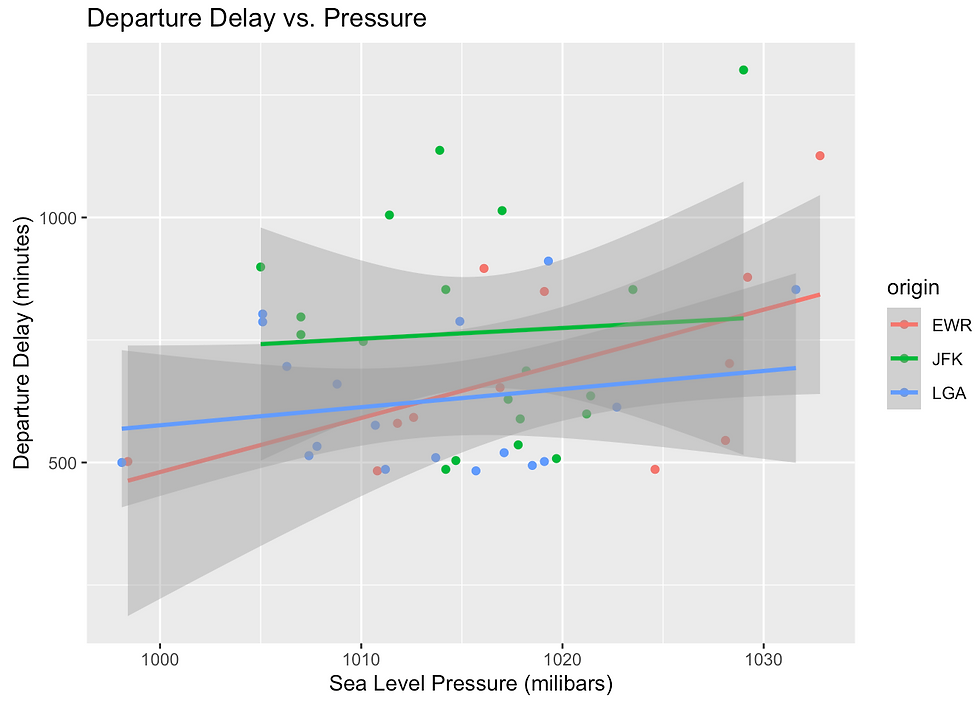

After all these charts, we found no direct relationship between delay and any weather factors.
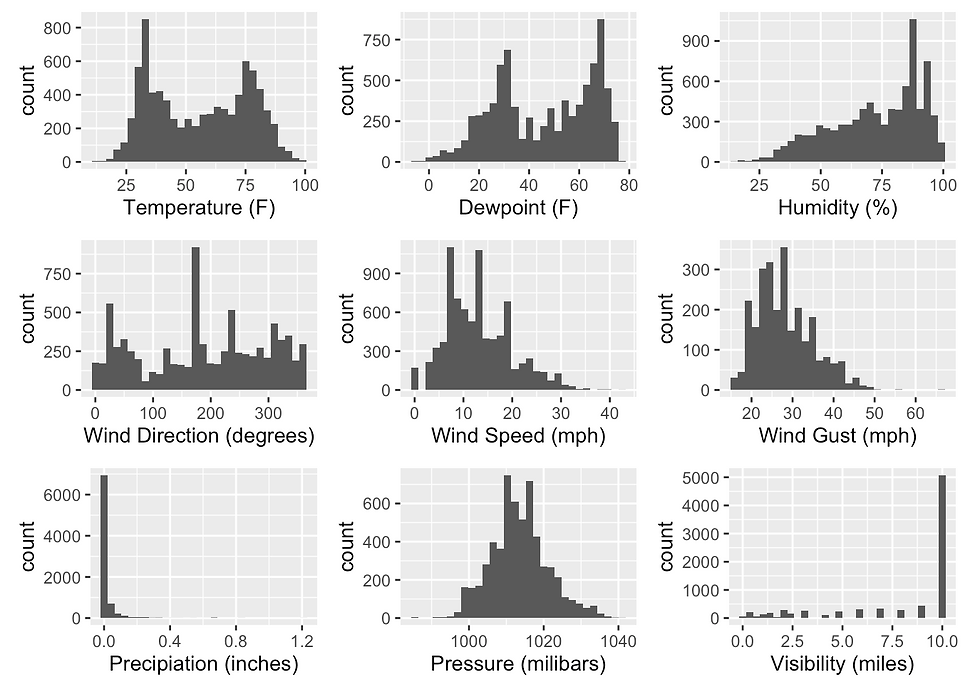
In order to better understand all of the flights, I decided to plot the histograms of all weather related aspects for the flights that were canceled as follows.


Comments