
Prevalent Greenwashing Activities and Potential Detection Model
- Sifei Liu
- May 7, 2023
- 11 min read

Preface
It was not all that long ago that corporate C-suits largely held the notion that their jobs were to maximize stakeholders' interests, so there is no doubt some still feel that way. However, the large trend is toward the bigger acknowledgement that they have more key responsibilities than just increasing the stock price, and this includes the ESG-related responsibilities. With today’s hottest topic, institutions and companies from different industries are working toward ESG transition progress to balance the business interests while embracing ESG- related policies and standards.
Considering ESG into business is a great revolution today, which means great changes for not only banking sectors but also all sectors all over the world. However, one concern falls into its frameworks, metrics and disclosures. Despite increasing disclosure around ESG factors, banks in particular continue to be challenged by a lack of robust, granular and forward-looking data from their borrowers and their counterparties to implement a structured value system. It also makes it difficult to assess its current ESG framework, while banks need to prepare for increased data and disclosure demands from their stakeholders, not the least of whom are their investors and customers subjected to scrutiny regarding ESG.
Our client Fifth Third Bank makes a commitment to sustainable development in its portfolio,
driven by its stated purpose to improve the lives of our customers and the well‐being of our communities. Our business strategy embraces an inclusive, sustainable path forward to bring positive impact both internally and externally. Our mission in this capstone is to help our client Fifth Third Bank to move to the next stage through picking clients/vendors who are truly going green instead of just greenwashing to better implement its value and culture in real business practice.
Prevalent Greenwashing Practices
Financial Service Industry
The financial services sector has had a dramatic increase in ESG and sustainable investments, which has also led to increasing concerns about firms confusing or even misleading consumers about the nature of some of these investments. Some investment funds claim to invest in environmentally responsible companies or projects, but in reality, their investments do not align with the values they promote. This can mislead consumers who are looking to invest in sustainable options.
Some financial institutions promote their green investments while ignoring the negative impact of their other investments. For example, a bank may advertise their investment in renewable energy while also investing heavily in fossil fuels.
Financial service providers may fail to disclose environmental risks associated with their investments, such as the potential impact of climate change on a particular industry or project.
Other Intustries
Consumer goods industry
There remain inconsistent reporting practices, both between different companies and between annual reports for specific companies:
Incomplete reporting of carbon emissions and greenhouse gases, often omitting emissions resulting from transportation and distribution
Inconsistent performance metrics (eg. emissions reported as metric tons, tons, emissions per dollar revenue; emissions reported as percent of total with no total reported)
( Inconsistent reporting practices between a particular company’s annual reports, resulting in ineffective comparisons from year to year
Inconsistent time frames for reported savings, varying from annual savings to savings reported from a base year that extends more than 5 years from the present
Inconsistent reporting practices between companies in the same industry, resulting in ineffective comparisons between companies )
Fashion industry
Claims of being more sustainable but only improving a negligible part of the fashion brands’ collections
Downcycling materials instead of focusing on fiber-to-fiber recycling
Promotion of take-back programs that incentivize guilt-free consumption
Eco-labeling or certification of the fashion industry
Claims of developing recyclable and biodegradable textiles, products, and full collections despite the lack of accurate material information and missing transparency
The design for sustainable consumption concept despite the fact that overconsumption of the environment and other chemicals contained in this material might cause harm to the environment
Food industry
The main concern of the papers dealing with greenwashing in agriculture is the need for sustainability, while the research about greenwashing in the food industry is specially linked with the perceptions of the consumers, mainly through the packaging and labels.
Oil and gas industry
Overstating the benefits of renewable energy sources: While renewable energy sources such as wind, solar, and hydro power are generally more sustainable than fossil fuels, some companies may overstate their benefits in order to promote them as a panacea for all energy-related environmental problems.
Hiding the environmental impact of energy production: The environmental impact of energy production can be significant, even for renewable sources. Some companies may hide the impact of energy production by focusing only on the operation phase and ignoring the impact of resource extraction, manufacturing, and end-of-life disposal.
Making false claims about carbon offsetting: Carbon offsetting allows companies to offset their carbon emissions by investing in projects that reduce greenhouse gas emissions. However, some companies may use carbon offsetting to justify their continued use of fossil fuels without making significant efforts to reduce their own emissions.
Misleading the public by its own scientific publications: oil giant ExxonMobil was criticized for misleading the public on the risks of climate change. The reports allege that the company’s efforts to fund climate change denial organizations and cast doubt on the science and the harsh realities of climate change contradict studies by its own scientists from the 1970s and 1980s. Despite cutting-edge findings that fossil fuel consumption contributes to global warming and irreparable damage to the planet, ExxonMobil opted to protect its economic interests over that of the environment and public good in suppressing the knowledge it generated and push its fossil fuel agenda and obstructionist approach to climate regulations.
Labeling some of the fossil fuel-based energy sources as “clean” or “green” just because they emit less carbon dioxide than other fossil fuels, but these energy sources are still non-renewable.
Comparison
General categories
Selective disclosure: Corporations with poor environmental performance based on toxic emissions tended to disclose at higher levels; while few authors indicated that firms disclosed more if they had better environmental performance.
Decoupling: companies claim to meet the expectations of their shareholders, without really changing their practices.
Attention deflection: symbolic activities designed to deflect the attention of stakeholders to hide corrupt business actions.
Deceptive manipulation: misleading conduct in which sustainable communication creates a deliberate operation of business practices to promote the perception that a firm’s products, aims and/or policies are environmentally friendly.
Dubious authorisations and labels: authorisation to external parties that define standards, replacing the trustworthiness of a third-party authoriser with a firm’s own rights.
Inefficient public voluntary programs: companies contribute to government-funded voluntary programmes for many reasons, but their contribution alone cannot bring about environmental improvements.
Other similarities
Misleading manipulation:
Intentional or unintentional omission:
Lack of usage of standardized format in reporting:
Difference between industries
The prevalent greenwashing activities in detail are varied from industry to industry, mainly because of the different natures of different industries. For example, the financial service industry is characteristic of green funds, fashion industry is characteristic of sustainable materials and energy industry is characteristic of renewable energy resources.
Data Dictionary
Our model is based on the grabbed keywords related to ESG problems first before building greenwashing detection mechanisms, which are named KPIs in our excel sheet called data dictionary. However, due to the time limitation, we mainly focused on the primary KPIs in the environment aspect (shown in ESG dictionary.CSV). Moreover, the data dictionary is a detailed guideline for further reference if following situations happen:
not enough open data and information disclosed online
more detailed qualitative explanation above the model results
questions towards one specific topic listed in our model matrix
To have an inclusive and detailed picture about greenwashing activities detection, we refer to professional organization's ESG rating systems to build our greenwashing measurement system.
As the focus of our analysis is on the environmental pillar in ESG problems,the excel sheet is mainly about the key words that frequently appear related to the environmental pillar.
The whole data dictionary comprises key issues and indicators to give a detailed category for further adjustments and understanding. The KPIs are the words applied in sentimental analysis to assess the extent to which companies are addressing ESG issues in a genuine and meaningful way, rather than simply engaging in greenwashing activities.
Even in cases where you encounter incomplete or ambiguous data, you could add or delete any kpis before putting selected KPIs into model analysis. By providing clear guidelines and definitions for each of your KPIs, as well as any other relevant terms and concepts, you can help ensure that your results are reliable and useful for decision-making.
All of the data dictionaries refer to professional data dictionary design, starting from data elements, establishing standards and developing data management controls.
Necessary Excel Column Name interpretation:
Secondary KPIs: not as important as KPIs, but still related to the topic
General: which means it could be applied in all situations depending on where it is put. Take an example, "general" under one specific key issue, it could be applied to all indicators under that specific key issue.
Standards for further data management:
first appear, first serve. Cross-topic KPIs will be settled in the first place where they appear. NO duplicated KPIs appear in one same sheet.
secondary KPIs: number is reduced to the minimum as it may lead to some confusion
Some standards or organizations have synonym, that will put behind it.
General Guidelines for Preparation, Modeling and Analyses
To detect the greenwashing activities, we need to verify whether there is inconsistency between the truth (source of truth) and how the companies advocated for themselves (source of marketing). To be more specific, we used the environment grading generated by S&P as the “source of truth”, and the environment parts in the 10-K report and ESG report as the “source of marketing”. We have obtained the S&P ESG score for 100 randomly selected US financial service companies by manually downloading it from WRDS, as well as their 10k and ESG reports from their respective websites. While we have created a data pipeline to automate the 10k download process, please be aware that the usage rights for the WRDS API belong to Duke University and we are unable to share our API key and that part of code with you at this time. Thank you for your understanding. (For your convenience, we have linked the documents to the relevant parts.)
Data Preparation
1. “Word_Frequency.py” or “Word_Frequency.ipynb”
The two parts of code are identical, with the only difference being that one is stored as a Python file, and the other as a Jupyter Notebook file. The code is designed to calculate the frequency of keywords that appear in the ESG reports and 10-K reports of individual US financial service companies, as well as the word frequency for the entire set of 100 companies.
The code requires three inputs:
This CSV file contains ESG-related words that we want to calculate the frequency of, specifically those related to the "Environment" aspect.
This file contains the ESG reports (PDF files) for the randomly sampled 100 US financial service companies. We selected the most recent year's reports as ESG reports, namely those from 2022, with the remaining reports from 2021.
c. 10k_file
This file contains the 10-K reports (PDF files) for the same 100 randomly sampled US financial service companies. We chose the 2022 fiscal year report as our 10-K reports.
Output:
This file is outputted in the "ESG Final File" and records the ESG report scores for each of the 100 companies. The formula of this score is
ESG score = (frequency * positive score) / total words
This file records the total frequency of ESG-related words that appeared in the ESG reports for those 100 companies
This file is outputted in the "10-K Final File" and records the 10-K report scores for each of the 100 companies. The formula of this score is
10k score = (frequency * positive score) / total words
This file records the total frequency of ESG-related words that appeared in the 10-K reports for those 100 companies.
2. “Greenwashing Detection” Tableau Dashboard
We obtained two files from our previous work: "ESG_report_words.xlsx" and "10k_report_words.xlsx". We combined the data from both files to create a new file called "word_frequency_combined.xlsx". We utilized this file to generate a Tableau dashboard called "Visualization.twb"." Tableau Dashboard Link:https://public.tableau.com/app/profile/guangliang.yu3251/viz/GreenwashingDetection/Dashboard1

Explanation of tableau dashboard:
This dashboard provides insight into the percentage of specific categories or words that appear in ESG reports or 10k reports for the US Financial Service Industry.
The "Specified Key Issues" represents the broad categories of ESG-related words, while the "Indicator" represents smaller, more specific subcategories. The "KPI words" are the words from the ESG dictionary.
The header at the top of the dashboard displays the average number of ESG-related words that appear in the reports for each category. For example, the current data shows that the "General" category in 10k reports has an average of 154.2 ESG-related words.
The "Specific Key Issues Ratio" chart shows the absolute number of words that appear in each category, as well as the percentage of ESG-related words within that category for ESG reports or 10k reports. For example, the "General" category has the most ESG-related words in ESG reports, and the second-most is the “general category” in 10k reports.
The "Indicator Ratio" chart provides more granularity by showing the percentage breakdown of small subcategories within each broad category.
The "Most Frequent KPI Words" chart shows the number and percentage of words for each Specified Key Issue in either ESG or 10k reports.
Key findings from the tableau:
The top 3 most commonly used words in ESG reports are ESG, sustainability, and compliance. In 10k reports, the top 3 most frequent words used are compliance, enforcement, and ESG.
Within ESG reports, 21.96% of the ESG-related words are related to climate risk. On the other hand, only 6.60% of the ESG-related words in 10k reports are associated with climate risk.
Modeling and Analyses
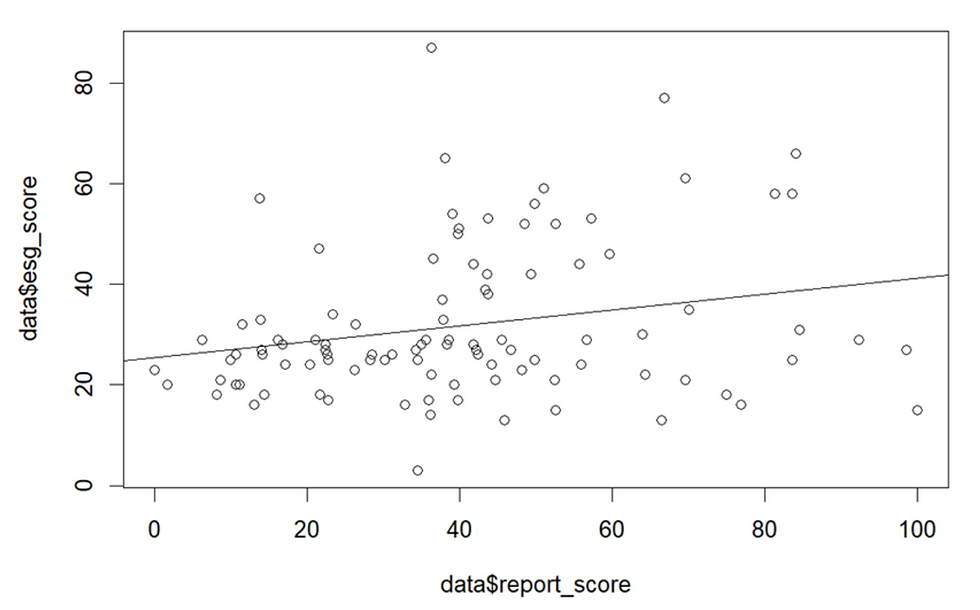
We use R to build models to create predicted companies ESG scores (from model) by their ESG report score and 10K score. (From python code in the previous step). And those that have low (high) S&P Global ESG scores but high (low) predicted ESG scores are companies that are potentially greenwashing (underselling). The final ESG scores of our sample companies are shown in ESGscore_final.xlsx.
Input:
Need to read a excel which contains 4 columns and 100 rows (100 companies) into R
Column A. ESG Report Scores
This column is outputted from the "ESG Final File" in the previous step and recorded as ESG report scores.
Column B. 10k Scores
This column is outputted from the "10-K Final File" in the previous step and recorded as10-K report scores.
Column C. S&P Global Scores
This column is downloaded from WRDS website, and the companies are consistent with column A and column B
Column D. Tickers
This column includes the companies’ tickers, which also obtained from WRDS website
Output:
1. Identify Overselling Companies:
a. Initial exploration of variables

b. Visualization of bootstrap procedure
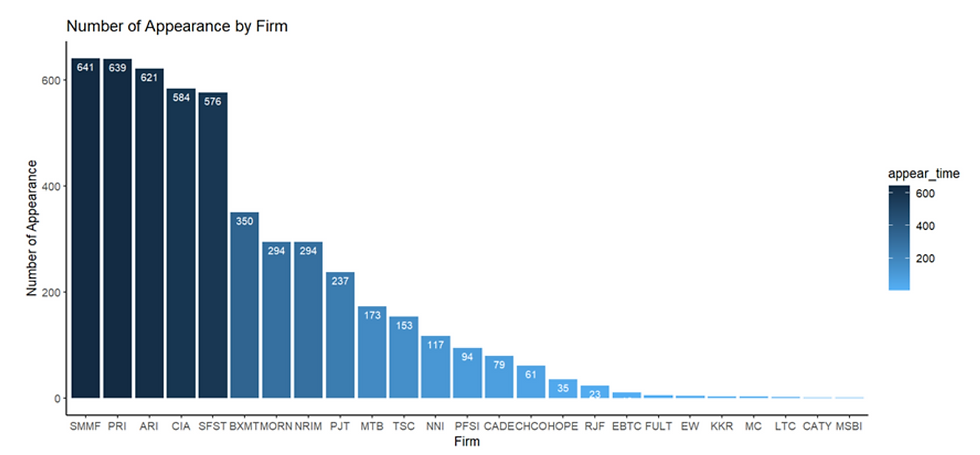
c. Visualization of robustness check and suspected companies in greenwashing:
SMMF, PRI, ARI, CIA, SFST

2.Identify Underselling Companies:
a. Visualization of bootstrap procedure
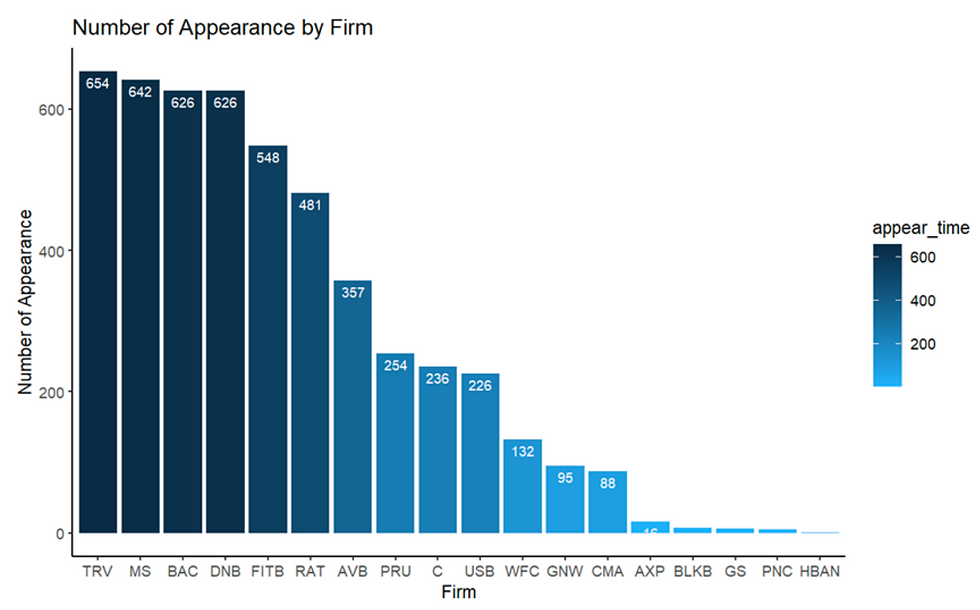
b. Visualization of robustness check and suspected companies in underselling:
DNB, BAC, TRV, FITB, MS, RAT

Notice: The bootstrap procedure selects samples with replacement randomly every time. Therefore, the result of running code will not be identical every time. However, after verifying many times, we found that the results (companies selected by model) are similar during different bootstrap procedures and robustness check.
The detailed comments are shown in R code called modeling.R.
Potential Improvements on the Existing Model
It is true that our model can detect greenwashing activities as a red flag in the financial service industry, so that our client can dive deep into the particular company more purposefully, but we are sure our client can improve more based on our work as follows:
Use of API: When we are modeling the part called “source of marketing”, we manually downloaded the ESG reports and 10-K reports from 100 companies’ websites, which is quite troublesome especially when you want to generalize the model. So a better way is to use an API to extract the two reports of a certain list of companies more widely and generally.
More multiple data sources:
On the “source of truth” side, we only used the environment grading from S&P. Actually the lawsuit website can be another “source of truth”, where the number of lawsuits of a particular company plays a role of penalty when needed.
On the “source of marketing” side, we only used how the companies advocated for themselves in the ESG report and 10-K report due to the technical difficulties we were confronted with. But actually their advocations and advertisements in the companies’ social media accounts and news feeds are also valuable sources. What is worth mentioning is that if you are going to use these sources, it is very important to limit the author who published this information to only the company itself instead of the customers.
A wider range of companies: When conducting the model, we only chose 100 financial institutions which went public in the US. If you are going to generalize the model, you can conduct the model in its own industry using the similar methodology we used in our model whenever you are interested in a particular company’s greenwashing behavior.
More accurate use of the dictionary: For convenience, we put the weight as an equal amount to each of the words in the dictionary. But sometimes some words are more important or more worth investigating than others. In that case, you can put different weights to the words according to their order of importance.


Comments