
Credit Card Fraud Prediction
- Sifei Liu
- Oct 17, 2022
- 8 min read

Updated: Mar 16, 2023
Sifei Liu, Clarise Wang, Lucy He, Yiqing Cui
1. Business Understanding
1.1 Problem Mining
Credit cards, which allow individuals or businesses to consume the products and
services in advance, are widely used around the world. However, the characteristics of
convenience and easier usage cause fraudulent behavior from time to time. According to Shift, $24.26 billion was lost due to fraud card transactions in 2018 all over the world,
causing great loss to issuers. Therefore, it is necessary for banks to detect the potential cyber crime arising from each credit card payment in advance to protect its customers. At the same time, credit card fraud detection is beneficial to help banks to save loss and increase bank solvency through preventing suspicious transactions from happening.
1.2 Business Value
● Scenario for Use
Banking industry is the main user industry of our final model. Suppose we are hired
as data analysts by a large bank who issues credit cards to create a model for a fraud alert system and maximize the profit for the bank.
● Final Goal
The final goal is to maximize the profit of the bank while trying to maintain accurate
predictions of the probability of fraudulent transactions.
● The importance of data mining solution
Once the model is built, we can use known variables to predict whether or not the
transaction is fraudulent before the transaction is being processed. Then appropriate actions can be taken to prevent further losses if the probability is above the threshold.
2. Data Understanding and Preparation
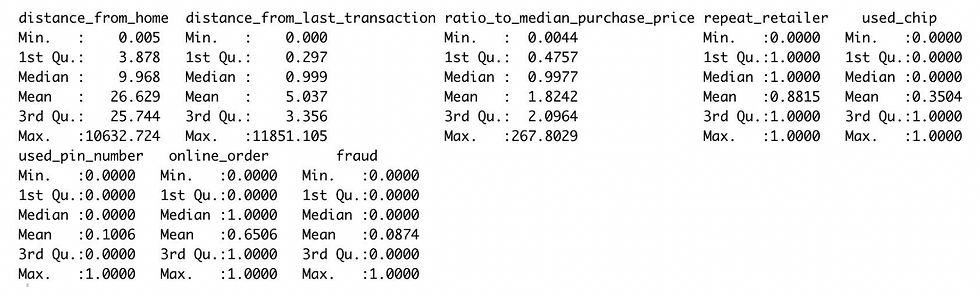
2.1 Description of dataset
● Source: A dataset available on Kaggle website, with 7 independent variables and 1
dependent variable. The dataset includes 1 million data points.
● Data instance/unit: Each credit card transaction is a separate data point.
● Target variable: Fraud, a binary dependent variable indicating whether or not a
transaction is fraudulent.
● Useful Features: distance_from_home, distance_from_last_transaction,
ratio_to_median_purchase_price, repeat_retailer,used_chip, used_pin_number,
online_order.
2.2 Data processing
We firstly checked if there are missing values in the original dataset and concluded
that there are no missing values. In order to get a better understanding of the characteristics of each feature, we looked at the summary of the whole dataset. The mean value of fraud is about 0.087, meaning that the majority of the available transactions are not fraudulent and the current dataset is skewed and highly imbalanced.
We then checked the correlation of each independent variable with the dependent
variable and concluded that except the fact that if the transaction is with a repeated retailer or not, all other variables are highly correlated to the independent variable.With the increase of distance for home, distance from last transactions, and ratio to median purchase price, and if the the transaction is an online order, then it will increase the probability of credit card fraud. And if the transaction happened from the same retailer and is through chips using a PIN number, the probability of credit card fraud will drop. And because the dependent variables are limited, we decided to keep all the variables when training models.

Originally, the dataset contained 1,000,000 data points. In order to run the analysis
effectively, we decided to randomly select 10,000 instances with an evenly combination of fraud and non-fraud instances (1:1). 9,000 of the newly selected data will be used to train the models. The rest of 1,000 will be used as a testing set for the deployment explanation.
In order to better understand the dataset, we employed K-means clusters with 8
centers. We found that when the pin number is used in the transaction, there is only 2% of the times that the transaction is a fraud. When the transaction happens far away from the card holder’s home address or the purchase price is highly over the median of the card holder’s previous purchase, there is about 90% of the times the transaction is a fraud.


2.3 Data Mining Problem
Supervised learning is used to resolve this classification problem. Classification
models are constructed to make binary predictions, while the models are evaluated by the total profit/loss of implementing fraud detection, based on the cost-benefit assumption below.
● Cost-benefit Matrix Assumption
Credit card companies make money mainly by collecting fees, including interest
charges, annual fees and late fees, among which the interest charges take the largest share of revenues. So we assume that the interest charges, which represent the percentage charged for the borrowed amount when the credit card users fail to pay off at the end of the month, are the only source for revenues of credit card companies.
On average, we assume that the average credit amount per transaction is $80. For not
permitting fraudulent transactions, the cost for requiring authorization for actual fraud is $30 per transaction (i.e. employee’ salaries, data maintenance fee, etc.). For permitting fraudulent transactions, we assume that reimbursement for fraud transaction is necessary and banks bear 70% of the total amount, so the cost for approving a fraud transaction is $56 (Average credit amount per transaction*70%= $80×70%=$56). For permitting non-fraudulent transactions, the interest revenue generated is $16 (Average credit amount per transaction × average interest rate = $80×20% = $16). For not permitting non-fraudulent transactions, banks cannot earn interest revenue and resources are needed in the process of authorization, so we assume the loss be $35 per transaction. The assumed amounts are denoted as A, B, C, D, which may be altered in practical use according to internal data about the cost and benefit. The four numbers should be in ascending sequence for A, B, C, D.

● Threshold calculation
As deployment, we do not permit transaction when expected value of not permit
exceeds expected value of permit,
− 30 × 𝑝 − 35 × (1 − 𝑝) ≥ − 56 × 𝑝 + 16 × (1 − 𝑝)
so we should not permit when 𝑝 ≥ 0. 662. The applied threshold of p is 0.662.
3. Modeling
3.1 Systematization
● Models picked
Logistic regression with interaction, LASSO, support vector machine (SVM), K
nearest neighbor (KNN), decision tree and random forest. Given our final goal, we used a 10-fold cross validation method and chose a model with the rule of maximizing the expected average profit.
3.2 Specific Models
● Logistic regression with interaction
From the logistic regression model, we can see that factors such as
distance_from_home, distance_from_last_transaction, ratio_to_mdian_puchase_price,
online_order and most interactional factors are significant to fraud, all of which can be used
to predict fraudulent behavior.
● LASSO
In order to investigate overfitting problems, we used Lasso to perform both variable
selection and regularization. Then we applied Lambda=1e-04, which concludes that the
number of variables chosen by Lasso is 7(same as the number of original variables), so there is no need to rule out any variables. Therefore, Post-Lasso can be abandoned.

● SVM
We also apply the support vector machine to separate the class. The SVM model
performs the best when using radial kernels and cost argument equals to 50. It means that a narrow margin is used where there are fewer support vectors on or violating the margin.
● KNN
K nearest neighbor is applied. All numerical variables are scaled before constructing
the model. The model performs the best when the K equals to 1.
● Decision tree
Classification tree is applied because it provides us with a better interpretation of the
decision making process. The model performs the best when the tree is not pruned, with size equals to 9. From the graph below, the first split is based on “ratio to median purchase price”, which implies that the model considers it as the most decisive factor.

● Random forest
Random forest is applied to the training dataset accompanied by 10-fold cross
validations. We chose to find best parameter amounts for random forest through the
comparison of average total expected revenue using the cost-benefit matrix assumed in the data understanding section.
4. Model Evaluation and Final Model
Given our final goal of the project, we apply a 10-fold CV on average profit/loss to
evaluate the model performance and choose the final model. After achieving 10 different possibilities based on 10 sample dataset in every model, we firstly calculate the total profit/loss based on the cost-benefit matrix considering every possibility, and then average the profit/loss to compare the model as follows:
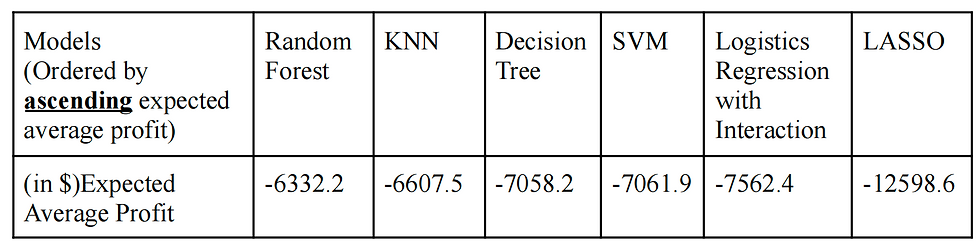
Based on the comparison of expected average profit for each model, the final model
chosen is Random Forest. The model has 5 minimum observations in a terminal node, 400 trees to grow and 2 variables randomly sampled as candidates at each split as parameters.
5. Deployment and Model Application
5.1 Practical use
Banks can prevent fraud in advance with the system to evaluate the possibility of fraud
of each transaction. Given that factors included in our model are location of transactions (including distance between where transaction happens and home address of customer, distance between where current transaction happens and where last transaction happened), ratio of transaction price to the median of the customer’s past purchases, whether or not the retailer for the current transaction is same retailer as that of last transaction, whether or not use chip or pin number and whether or not this transaction is ordered online, the banks can take the location information, amount spent of the transaction, the credit card user’s home address and the usage of both chip and pin numbers into the trained model. Based on the information, our chosen model can be applied to predict the probability of the transaction being fraudulent.
On one hand, if the model classifies the transaction as fraudulent, when the
probability is greater than or equal to 0.662, the bank should send out some alerts to the credit card user and temporarily interrupt the transaction until the holder's permission is acquired. When the prediction is accurate, banks can avoid fraud; when the prediction is wrong, customer satisfaction may decrease.
On the other hand, if the system predicts that the transaction is normal, when the
probability is less than 0.662, the system will permit the translation. If the prediction is
correct, all can operate normally. However, if the transaction proves to be a fraud, both the cost of fraud and dissatisfaction by customer should be considered.

After model selection, we apply random forest to the test set of 1000 transactions we
selected, the matrix of actual results and deployment is given below. Under the cost-benefit assumption the expected profit is -$7,130. If the bank chooses not to conduct fraud prediction and approve all transactions, the expected profit is -$20,000. The classification model helps the bank to save 64.35% of its total loss.

5.2 Ethical considerations
● Concern for information privacy
The acquisition of some particular information should be confirmed by the credit card user through signing a privacy contract. After the information is acquired, the bank should protect the information as much as possible.
5.3 Risks associated and relevant solutions
● Moral hazard
Since some compensation will be provided once the interruption of transactions
proves to be incorrect, some customers might take advantage of that through pretending to experience credit card fraud and earning some additional interest. In order not to lose money for the moral hazard among the customers, the bank should constantly improve the model once false predictions accumulate to a certain number of cases and limit the amount of compensation to the corresponding amount of the fraud transaction.
● Losing customers and causing cost because of inaccurate prediction
When the prediction proves to be wrong, the customers tend to be dissatisfied and the
usage of credit cards will decrease. Therefore, the cost of the bank may be greater than what we assumed when customer relationships are affected. For this risk, firstly, the system should be updated whenever possible with more dimensions of information of the transactions and more comprehensive predictive considerations through collecting more variables.
Additionally, once the fraud is found, the bank should track the fraud, block the credit card and compensate for the loss of the customers. Usually, customers will reach out to the banks if a suspicious transaction appears on their history of transactions, so the contact representatives should be trained in the way that they show apology and patience to customers.
Appendices (division of work)
References
[1] R, D. N. (2022). Credit Card Fraud. Kaggle. Retrieved October 14, 2022, from
https://www.kaggle.com/datasets/dhanushnarayananr/credit-card-fraud?resource=download
[2] Credit Card Fraud Statistics. Shift Credit Card Processing. (2021). Retrieved October 14,
2022, from https://shiftprocessing.com/credit-card-fraud-statistics/
[3] Best, R. de. (2022). Average value of transaction per credit card worldwide by Brand.
Statista. Retrieved October 14, 2022, from https://www.statista.com/statistics/279249/purchase-transactions-on-general-purpose-cards-worldwide/


Comments